

Foreword
This article was originally published on the company’s internal ATA platform and was later reorganized into its current form after a data disclosure review. As such, the article contains many introductions and links to internal systems. These links and platforms are not accessible outside the company’s intranet, but this does not affect the overall readability and understanding of the article. This article is also published on the Alibaba Developer Platform at: Experience Summary | How We Optimized Alibaba.com Buyer Performance
Background
Why Performance Optimization is Necessary
From a macroscopic perspective, for most websites, two main factors influence the ultimate business benefits:
- Overall user base
- User conversion rate within the website
业务效益 = 用户规模 * 转化率Therefore, to enhance business benefits, it’s essential to increase both the user base and conversion rate.
User Base
Users primarily consist of new and returning users, each with their own traffic composition. However, regardless of whether they are new or returning, all users go through the process of landing on our website (on-site) from their client (off-site).
Especially for Alibaba.com, as a global website, users from countries with advanced network infrastructure like Europe and America to less developed third-world countries access our site via computers or mobile devices.
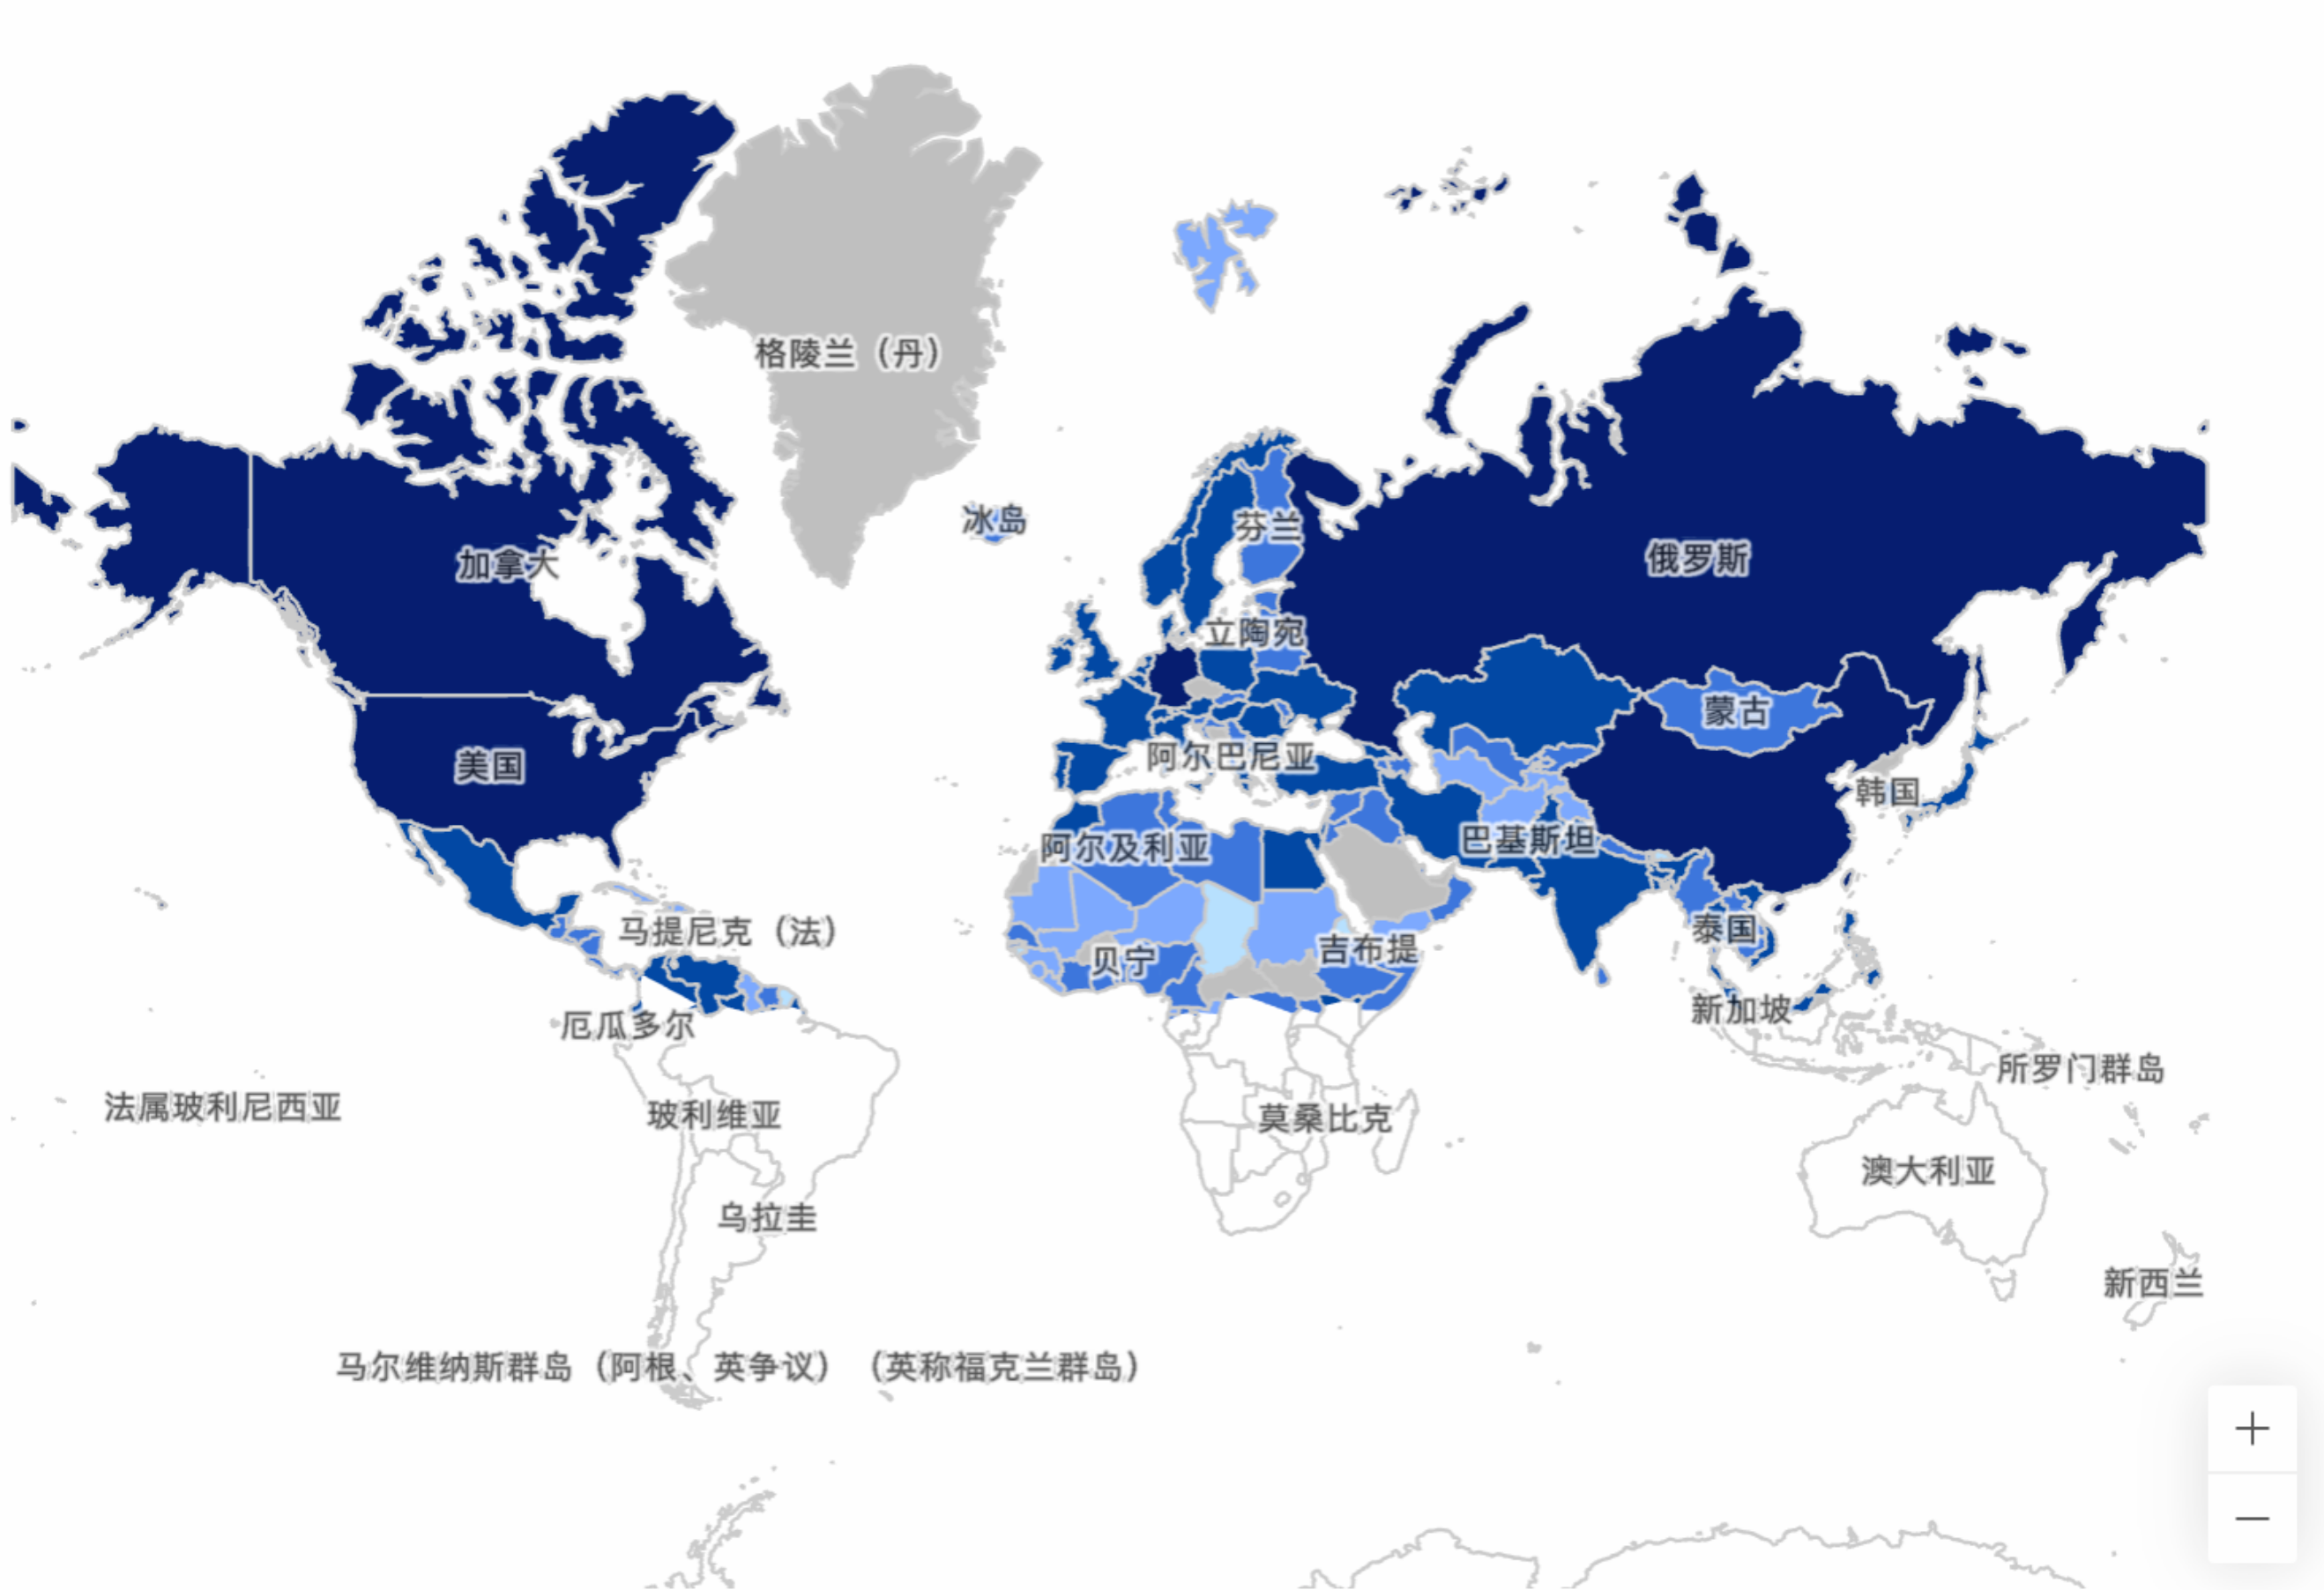 User country distribution map for a specific Alibaba.com page
Complex network conditions and current technical limitations can lead to slow page loading. Users are likely to abandon the site rather than endure a long white screen wait, resulting in user churn. Many case studies illustrate the impact of loading performance on user base:
- At the BBC we’ve noticed that, for every additional second a page takes to load, 10 per cent of users leave.
- The result of rebuilding our pages for performance led to a 40 percent decrease in Pinner wait time, a 15 percent increase in SEO traffic and a 15 percent increase in conversion rate to signup.
Thus, website loading performance directly impacts the number of users who ultimately land on the site.
Conversion Rate Numerous factors influence conversion rates: the value provided by the website, user willingness, and page user experience are all significant. Website interaction performance, in particular, is a major determinant of user experience.
If a website experiences element flickering during loading, choppy scrolling, or a one-second delay in responding to a button click, it severely degrades user experience. This directly affects user click-through rates and bounce rates, ultimately impacting conversion rates.
That’s why we need to optimize performance.
Why Continuous Performance Optimization?
Why is performance optimization brought up repeatedly every now and then?
- Performance degradation: As business evolves and features iterate, more and more functionalities are gradually added to existing services. This increase in functional complexity leads to a gradual deterioration of performance.
- Metric iteration: With technological advancements and the pursuit of ultimate user experience, more accurate and user-centric performance evaluation metrics are proposed and adopted. Optimization results guided by older metrics may not necessarily be applicable under new ones.
For these reasons, our current page performance is not ideal.
Goals
Our performance optimization goal is for the core browsing path pages on the buyer-facing frontend to meet the ‘Good URL’ standard under the Core Web Vitals metrics.
What are Core Web Vitals?
Core Web Vitals (hereinafter referred to as CWV) is a set of page experience measurement standards proposed by Google to evaluate page performance, consisting of multiple metrics. Currently, it primarily includes three metrics: LCP, FID, and CLS.
- LCP: Largest Contentful Paint, measures loading performance.
- FID: First Input Delay, measures interactivity.
- CLS: Cumulative Layout Shift, measures visual stability.
Why Adopt Core Web Vitals as Measurement Metrics?
As seen from the explanation of CWV above, these core metrics evaluate the characteristics a good page performance should possess from three perspectives: page loading speed, user input performance, and page visual stability. These three metrics are also key elements of user experience. Compared to our previous measurement method, ‘hero element time’ (where developers from each business line defined a critical page element and measured performance by its rendering completion time), CWV metrics are clearly more comprehensive, more universal, less susceptible to manipulation, and have stood the test of the entire industry.
Below are Google’s official statistics on performance improvements for real websites optimized under CWV metrics:
Why page performance matters Studies show that better Core Web Vitals improves user engagement and business metrics. For example:
- When a site meets the Core Web Vitals thresholds, research showed that users were 24% less likely to abandon page load.
- With each 100ms reduction in Largest Contentful Paint (LCP), web conversion rate for Farfetch increased by 1.3%.
- Reducing Cumulative Layout Shift (CLS) by 0.2 led Yahoo! JAPAN to a 15% increase in page views per session, 13% longer session durations, and a 1.72 percentage point decrease in bounce rate.
- Netzwelt improved Core Web Vitals and saw advertising revenues increase by 18% and page views by 27%.
- Reducing CLS from 1.65 to 0 significantly uplifted domain rankings globally for redBus.
It’s clear that improvements in LCP, FID, and CLS can genuinely lead to business growth. This is both why we undertake performance optimization and why we chose CWV as our measurement metrics.
For more reasons to choose CWV as measurement metrics, refer to:
- Why Google chose Core Web Vitals as the new page experience ranking factor
- Globalized Frontend Performance Measurement
Therefore, we have set Core Web Vitals as our performance measurement metrics, with the goal of meeting the ‘Good URL’ standard, which means:
- LCP < 2500ms
- FID < 100ms
- CLS < 0.1
Optimization Methodology
Performance optimization is a perennial topic, with many ready-made solutions and methods available online. However, simply adopting these solutions or methods directly may not necessarily help us quickly achieve our goals. For instance, the famous Yahoo! performance rules stated that static resources should be distributed across multiple domains to increase the number of concurrent browser requests. However, with the development of technology and the widespread adoption of HTTP/2, this approach is no longer applicable. Another example is an article claiming that the for loop in JavaScript is much faster than forEach for array iteration, suggesting we should use for for better performance. You might spend days changing all forEach loops to for loops, only to find no change in CWV metrics.
Therefore, for performance optimization, we cannot simply copy others’ solutions; instead, we must master the methodology, as theory guides practice. For performance optimization, the methodology is: measurement, analysis, and validation.
Measurement
If we cannot measure the current state of a page, then optimization cannot even begin.
Thus, the primary task in performance optimization is to have a solution for measuring the current performance status of pages, providing data support for subsequent analysis and optimization.
As mentioned earlier, we chose CWV as our performance measurement metrics. Google provides many ways to detect CWV, including testing tools and platforms like PageSpeed Insights, Chrome Developer Tools, Search Console, and web.dev measurement tools.
However, they all share a common issue: they cannot real-time monitor the overall statistical values of actual online users. Either they only provide single evaluation results through local, one-time tests similar to PSI (PageSpeed Insights), or they, like Google Search Console, only display actual statistical values for a large number of users after a certain delay.
Real-time performance data is crucial for us. Without it, the following problems arise:
- Inability to quickly validate experimental solutions; waiting two weeks to see the effect of each deployed solution is an unacceptable efficiency.
- For major refactorings, if they cause a severe performance drop without real-time data feedback, by the time data is reviewed two weeks later, significant business losses may have already occurred.
Therefore, we must have a real-time performance data observation solution to guide whether our optimization strategies or directions are correct.
Ultimately, we chose web-vitals to obtain CWV values. We added corresponding data points to ICBU’s unified performance monitoring script, big-brother, to report each user’s performance data and established relevant performance monitoring and reports to observe page performance data in real-time. For details, refer to: Google Core Web-Vitals Statistics & Monitoring.
PS: You can now directly integrate with agado to quickly obtain more detailed performance data.
Analysis
By combining the performance data obtained in the previous step, we can systematically analyze the current performance status of each page. Knowing whether it’s slow, why it’s slow, and specifically where it’s slow allows us to perform targeted optimizations.
Taking a typical frontend-backend separated page as an example, the components of LCP are as follows:
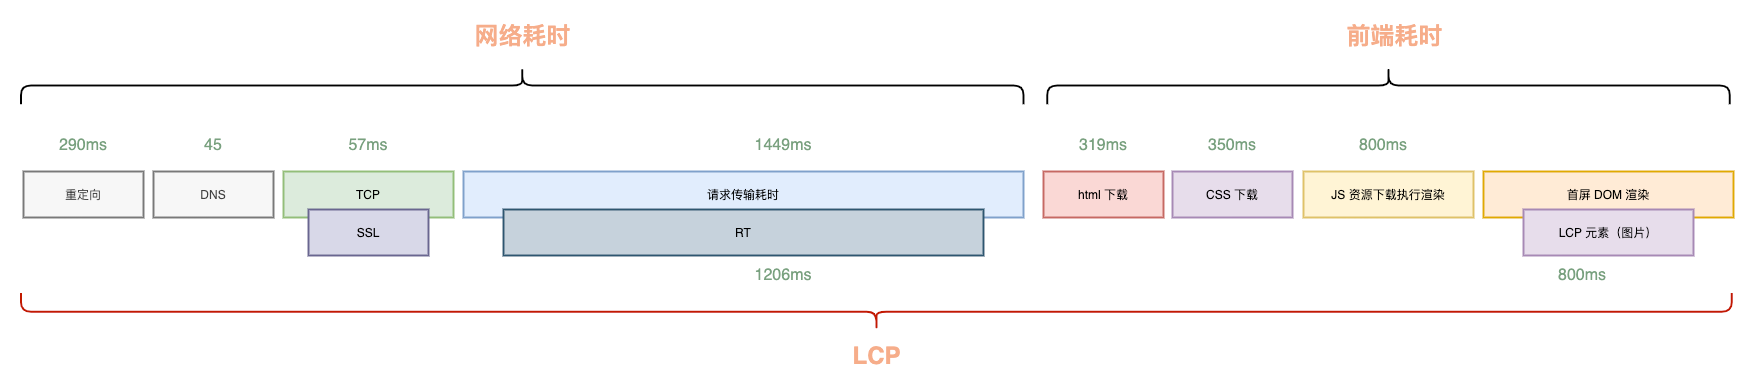
As you can see, from the user opening the browser until the LCP appears on the page, the process involves connection establishment, backend response, HTML transfer and download, frontend resource download, and finally parsing and rendering. This chain is very long, often resulting in an LCP far exceeding 2500ms.
To reduce LCP time, without considering technical details, it’s easy to realize that we need to shorten each time-consuming component or make them run in parallel as much as possible. This is the core principle of our LCP optimization: reduce what can be reduced, parallelize what cannot be reduced.
Looking at the components of LCP, the time spent on redirects, DNS resolution, connection establishment, and network transfer is primarily limited by third-party factors or the user’s own network conditions, so there’s not much we can do there.
Therefore, the core optimization direction should focus on areas beyond network latency that we can control, specifically:
- Optimization of the LCP timeline composition: identifying which parts can be removed and which can be parallelized within the existing LCP timeline.
- Optimization of the time consumption of each step within the LCP timeline composition: specifically, optimizing backend RT (response time) and frontend resource download, parsing, and execution times, apart from network latency.
We analyze and optimize these two directions through rendering architecture optimization and critical rendering path optimization, respectively. Backend RT optimization is not covered in this article.
Rendering Architecture Optimization
From a macroscopic perspective, the choice of rendering architecture is crucial. A reasonable architectural choice can raise the system’s performance baseline and lay the foundation for further optimization.
Following the core principle of LCP optimization: reduce what can be reduced, parallelize what cannot be reduced. From the previous LCP composition diagram, it’s clear that:
- Traditional page rendering does not rely on JavaScript loading, meaning this part of the time can potentially be saved.
- The loading of frontend resources and backend response, two major time-consuming components, are sequential. Is it possible to make them parallel?
These two optimization directions correspond to our rendering architecture optimization solutions: isomorphic rendering (SSR) refactoring and streaming rendering.
Isomorphic Rendering (SSR) Refactoring
The most cost-effective optimization under rendering architecture is isomorphic rendering (SSR) refactoring. With infrastructure support, it can yield significant and predictable performance improvements with relatively low human resource investment. Generally, SSR refactoring can bring a performance boost of 500-800ms.
As mentioned earlier, most of our current businesses use a frontend-backend separated architecture. The advantage of this architecture is reduced communication and release/maintenance costs between frontend and backend, allowing both ends to develop in parallel and maintain their codebases independently, leading to higher stability. However, the problem with this architecture is that, due to the separation, the HTML output by the backend only contains a skeleton without content. The frontend then needs to perform another rendering, which depends on JavaScript download and initial screen data fetching, lengthening the rendering chain.
Can this extra rendering time be saved? The answer is yes. Isomorphic direct output (SSR) is designed to solve this problem. With the same frontend-backend separated architecture, it’s possible to achieve direct page output by running a single JavaScript codebase on both the frontend and backend, without sacrificing development or collaboration efficiency.
This eliminates the additional time for frontend JavaScript download, parsing, execution, and rendering, typically saving 500-800ms. However, the trade-off is the need to maintain an additional isomorphic service.
For isomorphic services, we currently have the general isomorphic service silkworm-engine (an internally built service), store-specific isomorphic services, and isomorphic services provided by the group’s Tmall platform for marketing and guidance. For general business needs, integrating with silkworm-engine is sufficient, and the integration cost itself is not high.
Streaming Rendering
As early as 2010, Facebook engineers proposed the BigPipe page rendering solution. It progressively renders a large page by dividing it into multiple pagelets, primarily to address the issue of excessive backend time taken to render a large page all at once.
This solution was very advanced in its thinking, but it had a significant drawback: high invasiveness, making such a refactoring unlikely with our existing technical architecture. However, the underlying principle, namely the chunked transfer encoding feature of HTTP/1.1 (at the time, now default in HTTP/2 and later), can guide us to implement lower-cost optimizations, specifically streaming rendering. This involves splitting the backend’s one-time business processing, VM template rendering, and return into two steps:
- First, return the HTML
<head>section, which does not depend on any business logic. Once the browser receives it, it can start downloading static resources. - After returning the first segment, synchronously perform business logic processing, such as product data requests and calculations, then render the VM and return the remaining
<body>section of the HTML.
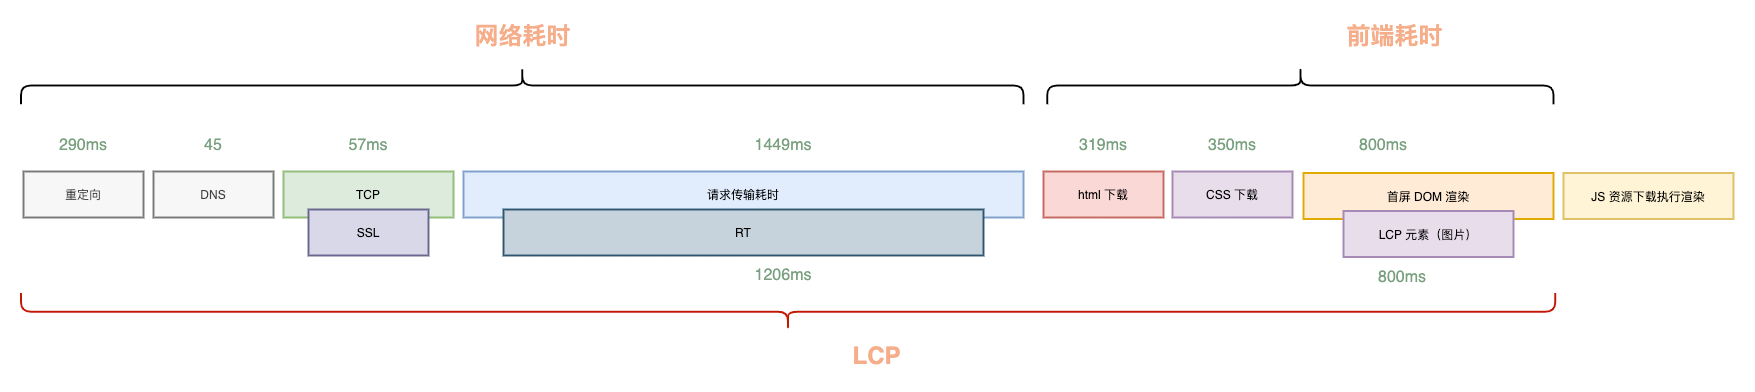
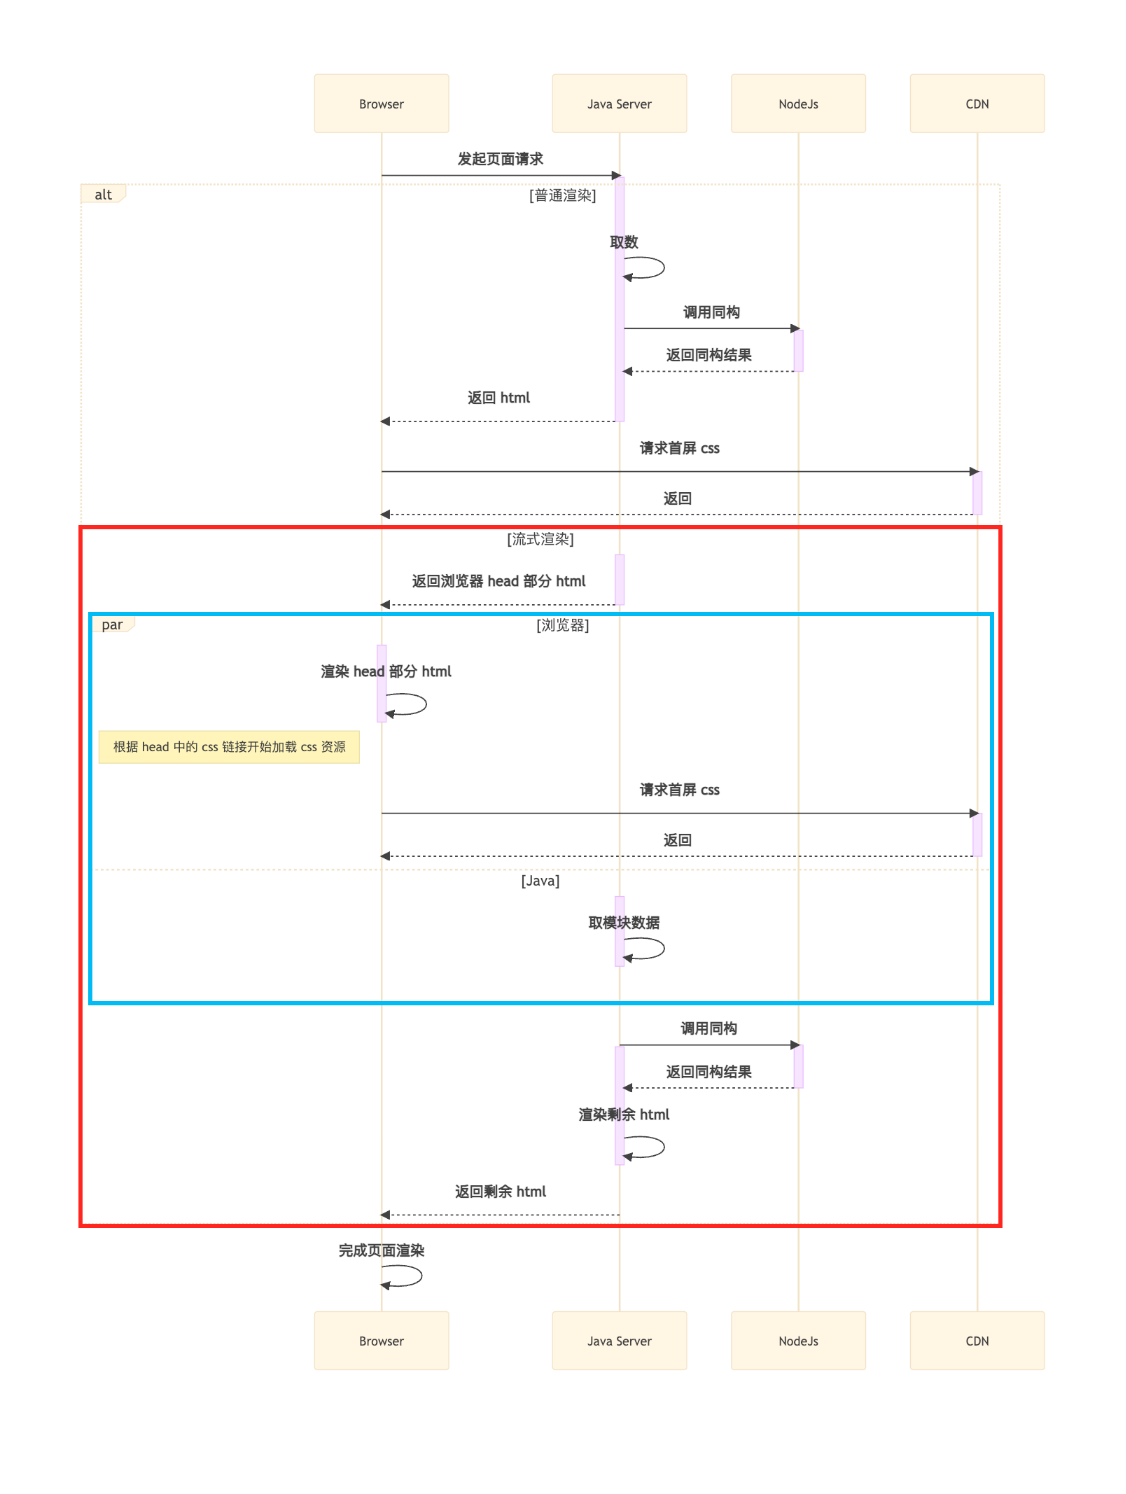 As shown in the streaming rendering solution, the download and parsing of the
 <head> (blue box) and the download of initial screen CSS and other resources run in parallel with the backend’s data fetching and computation.
This allows us to save Min(frontend initial screen resource download time, backend RT) time, typically resulting in an optimization of about 300-500ms. The optimized timeline is as follows: 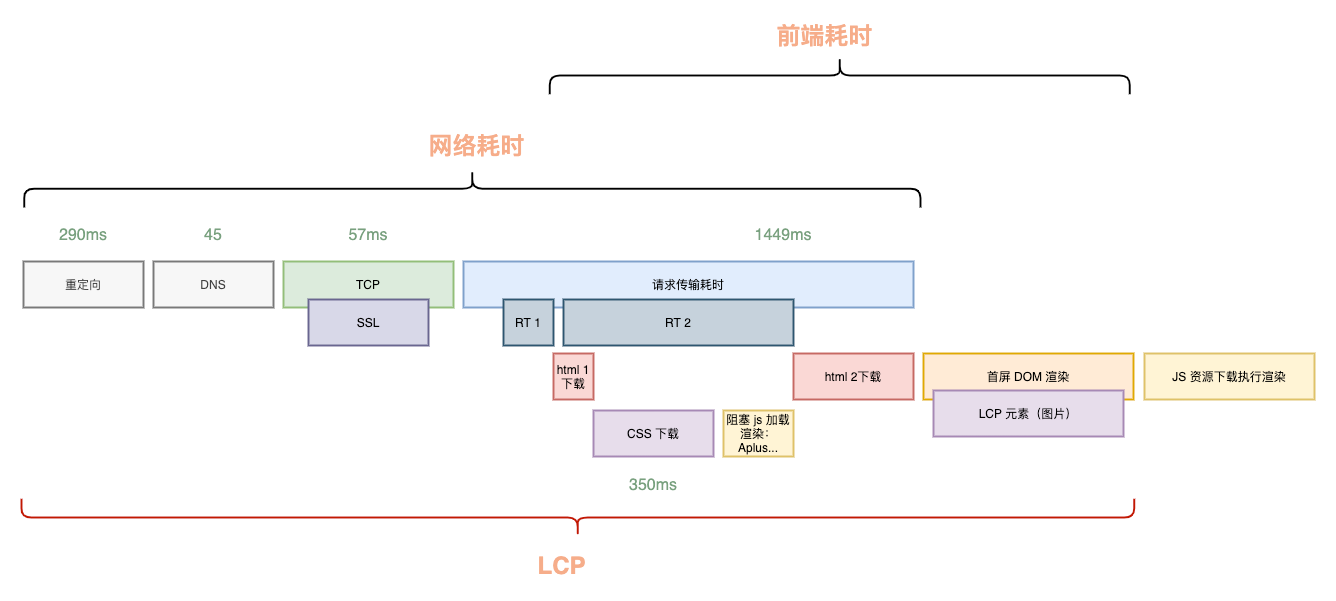 Engineering solutions for streaming rendering integration are also available:
- For Java applications, refer to the Streaming Rendering - Java Client Integration Document for integration.
- For Egg applications in Node.js, refer to: Spark: Five-Minute Streaming Rendering Integration.
Rendering Architecture Summary
Through optimizations in rendering architecture, specifically isomorphic refactoring and streaming rendering, a performance improvement of over 1 second can generally be achieved. These optimizations are not business-scenario specific; by following the steps, almost all pages can undergo these two transformations and gain noticeable benefits.
Furthermore, unless other rendering architecture optimizations are implemented, this improvement of over 1 second generally will not degrade with functional iterations of the page’s project, ensuring a performance baseline.
Critical Rendering Path Optimization
Quoting MDN’s definition of the Critical Rendering Path (hereinafter referred to as CRP):
The Critical Rendering Path is the sequence of steps the browser goes through to convert the HTML, CSS, and JavaScript into pixels on the screen. Optimizing the critical render path improves render performance. The critical rendering path includes the Document Object Model (DOM), CSS Object Model (CSSOM), render tree and layout.
Simply put, it’s the sequence of steps the browser goes through to convert HTML, CSS, and JavaScript into pixels on the screen. Optimizing these steps, which include the Document Object Model (DOM), CSS Object Model (CSSOM), render tree, and layout, can improve initial screen rendering performance.
CRP optimization involves the browser’s rendering principles:
- The browser first needs to download and parse the HTML to generate the DOM tree.
- During DOM parsing, when a CSS file is encountered, it is downloaded and parsed to generate the CSSOM.
- The render tree is generated based on the DOM tree and CSSOM.
- Layout is performed based on the render tree.
- After layout is complete, the specific content is painted onto the screen.
When the DOM or CSSOM changes, for example, by manipulating DOM nodes via JavaScript or dynamically inserting <style> tags, the browser re-executes the above steps. Understanding the principles of CRP reveals several factors that influence it:
- HTML file download and parsing time
- CSS file download and parsing time
- Synchronous JavaScript file download and parsing
- Size of DOM and CSSOM
- And layout and painting time
Among these, HTML, CSS, and synchronous JavaScript resources are what we call critical resources, as their download and parsing times affect various stages of the CRP. Therefore, we only need to optimize the download and parsing of critical resources, as well as the size of the DOM and CSSOM.
- For critical resource optimization, we can reduce the number of critical resources, decrease resource size, adjust the loading order of critical resources, and implement caching, among other methods.
- For DOM and CSSOM optimization, we can reduce the number of DOM nodes, decrease the size of the CSSOM, and reduce the depth of the DOM and CSSOM.
Caching
Static resource caching can be used to reduce resource download time, shorten the critical path length, and improve page rendering speed. Specific solutions:
- Set resource cache duration
- Static resources via CDN
- Separate static and dynamic resources
Static Resource Cache Configuration
This article will not delve into the specific definitions of HTTP Caching specifications. Simply put, caching can be divided into two categories:
- Strong caching: Uses locally cached content directly without initiating a request during the cache’s validity period.
- Weak caching or negotiated caching: After local cache expires, a request is initiated to negotiate with the server before using the local cache.
For typical Assets applications, you can specify resource cache times by adding a .assetsmetafile in the project root directory. The example below configures both the browser and CDN (for specific vendors) to cache for 1 year:
cache-control:max-age=31536000,s-maxage=31536000This way, as long as the application containing the resources is not redeployed (only for non-overwrite deployments where links remain unchanged), requests for a year will directly use cached content.
Leveraging CDN
CDN Static Acceleration
While placing static resources on a CDN is standard practice, this article still highlights it because some resources on our website, such as <img src="//icbu-cpv-image.oss-us-west-1.aliyuncs.com/Had9f38eda3d942aa9e65ee9198b0660fU.jpg_300x300.jpg">, are not distributed via CDN. Instead, users must request and download these resources from the origin server every time.
CDN Dynamic Acceleration
The concept of CDN dynamic acceleration might not be very common. Its ‘dynamic’ nature is in contrast to the ‘static’ in static acceleration, referring to the difference in the objects it acts upon.
In principle, it simply leverages the inherent advantages of CDNs: geographically close edge nodes that are widely distributed. Through specialized optimizations by CDN providers, an optimal route from the user to the origin server is found from within the CDN’s node machines, avoiding multiple external network gateways. This shortens the network latency between the CDN node and the origin server, making dynamic requests from users that go through CDN nodes to the origin server much faster than if users accessed the origin server directly.
According to our statistics, dynamic acceleration yields benefits of 200ms+.
Improve Cache Hit Rate
If the deployment frequency is too high, and resource URLs change frequently due to version number changes, then local caching loses its original purpose, beyond just consuming local storage resources.
Therefore, we need to improve the cache hit rate for static page resources. The common method to achieve this is separating static and dynamic resources.
This can be done by layering the JavaScript and CSS dependencies of a page. Common dependencies like React, ReactDOM, Fusion, etc., are bundled into a public bundle, which we call static resources. Business-related dependencies are bundled into a business-specific bundle, which we call dynamic resources.
Since the deployment frequency of static resources is much lower than that of dynamic resources, in most feature iterations, only the upper-layer business application is deployed. For users, this means only needing to download dynamic resources, while static resources, being unchanged, can be read directly from the cache, accelerating resource loading.
This approach improves the overall resource cache hit rate, preventing the issue where even a single line of code change in a monolithic JavaScript or CSS bundle forces users to re-download the entire bundle.
Connection Establishment
As mentioned earlier, the famous Yahoo! performance rules stated that static resources should be distributed across multiple domains to increase the number of concurrent browser requests. This was due to browser limitations on the number of requests per domain and the fact that under HTTP/1.x at the time, a single TCP connection could only handle one HTTP request. This optimization was proposed to allow browsers to parallelize requests for multiple resources simultaneously.
By the HTTP/2 era, a single TCP connection could handle multiple requests in parallel. Coupled with HTTP/1.1’s Connection: Keep-Alive for connection reuse, the previous optimization approach became largely irrelevant.
Domain Consolidation
In fact, distributing resources across different domains meant that each domain required a new DNS resolution, connection establishment, and other processes, turning what was originally an optimization into a negative one.
Therefore, addresses distributed across multiple different domains need to be consolidated under a single domain to reduce the number of DNS resolutions and achieve better results through connection reuse and concurrent requests.
For more on HTTP/2 features, refer to: HTTP/2 – A protocol for greater performance.
Pre-connection
As mentioned earlier, DNS resolution and connection establishment are time-consuming operations. To address this, browsers provide methods for early DNS resolution and connection establishment: dns-prefetch and preconnect.
dns-prefetch is a new HTML5 attribute used to tell the browser to resolve a domain name in advance. This way, when the browser needs to resolve that domain, it doesn’t have to do so again and can directly use the cached result. DNS-Prefetch can be used in two ways:
<link rel="dns-prefetch" href="https://s.alicdn.com/" />preconnect: tells the browser to establish a TCP connection, perform DNS resolution, and TLS handshake in advance. This way, when the browser needs to use this domain, it doesn’t have to perform these operations again and can directly use the cached result. Simply add the following meta tag in the <head> section:
<link rel="preconnect" href="https://s.alicdn.com" />PS: Note that preconnect actually establishes a connection, which is a relatively heavy operation. Therefore, it should only be used for domains corresponding to critical resources; otherwise, establishing too many connections in advance might have a negative impact on the page. Since dns-prefetch has better browser compatibility than preconnect, it is recommended to use a combination of dns-prefetch and preconnect:
<link rel="preconnect" href="https://s.alicdn.com/" crossorigin />
<link rel="dns-prefetch" href="https://s.alicdn.com/" />
Preloading
For core resources that the page depends on, we can use resource preloading to download critical resources in advance, thereby shortening the time required for CRP. The effect is as follows:
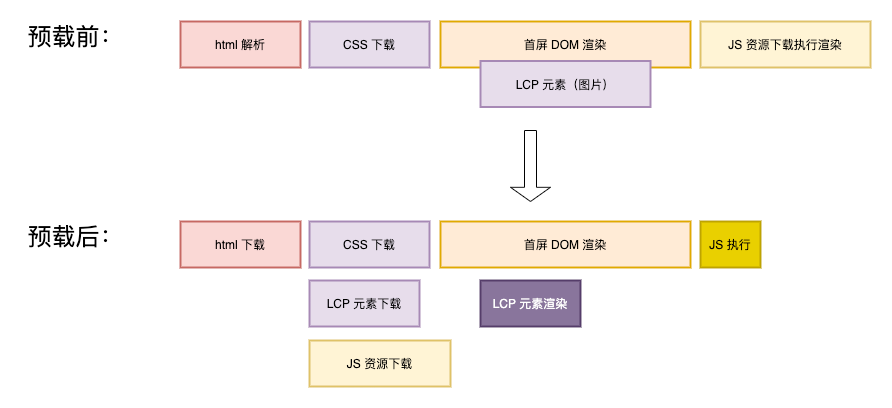
Achieved by adding a preload meta tag in the HTML <head>:
- CSS:
<link rel="preload" href="styles/main.css" as="style"/> - JS:
<link rel="preload" href="main.js" as="script" />
Subsequently, when the corresponding preloaded resources need to be loaded, they do not need to be fetched from the network again.
Asynchronous Loading of Non-Critical Content
Our website is content-rich, which implies complex functionality and a large codebase. If users have to wait for the entire initial screen to load before they can interact, the user experience will be poor.
To solve this problem, we can asynchronously load non-critical content. This allows users to use the core functionalities of the website immediately after the initial screen loads, while non-critical content can be used once it finishes loading later.
In terms of implementation, users building code with webpack can achieve this directly through dynamic import.
For example, on the PPC PC page, we asynchronously loaded the left-side filters to allow users to see the more critical product list earlier:
import React, { lazy } from "react";
import SSRCompatibleSuspense from "../../component/ssr-suspense";
import { Icon } from "@alifd/next";

function LeftFilterAsync({ data }: { data: PPCSearchResult.PageData }) {
  const TrafficLeftFilter = lazy(() =>
    // NOTE:页面的左侧筛选,功能复杂,但不属于用户首屏需要的内容,所以异步加载
    import(/* webpackChunkName: "left-filter" */ "@alife/traffic-left-filter")
  );
  const handleChange = (link: string) => {
    xxx;
  };
  return (
    <SSRCompatibleSuspense fallback={<Icon type="loading" />}>
      <TrafficLeftFilter
        data={data?.snData}
        i18n={data?.i18nText}
        handleChange={handleChange}
      />
    </SSRCompatibleSuspense>
  );
}

export default LeftFilterAsync;
Selective Rendering
When code cannot be further split, but there’s a large amount of content to render, leading to a huge number of DOM nodes, it impacts CRP time. In such cases, selectively rendering more critical content on the initial screen can reduce the initial rendering time.
For example, on the mobile showroom page, the backend returns 48 products for the initial screen, but most mobile phones can only display 4 products on the first screen. Therefore, we only render the first 8 products initially, and subsequent products are rendered in a second pass after JavaScript is ready.
This approach, for synchronously rendered pages, reduces HTML size, speeding up HTML download, and simultaneously decreases the number of DOM nodes on the initial screen, thereby reducing the time it takes for the browser to generate the DOM Tree.
Ultimately, this reduces the time required for CRP.
FID and CLS Optimization
The preceding lengthy discussion focused on LCP-related optimizations because buyer-facing pages are primarily display-oriented and generally lack highly complex interactions. Therefore, FID and CLS issues are not as prominent, and developers only need to be mindful of them.
FID
FID: First Input Delay, the time from when a user first interacts with your site until the browser is actually able to respond to that interaction.
This time is primarily determined by JavaScript execution time. When the browser’s main thread is executing JavaScript, it cannot respond to user actions, ultimately affecting FID. The optimization directions are therefore:
- Reduce JavaScript execution time
- Split heavy computational tasks in JavaScript
Reduce JavaScript Execution Time
Limiting the overall size of JavaScript dependencies on a page can very directly reduce execution time.
For the page’s main JavaScript, use code splitting to lazy-load code for non-critical initial screen functionalities. Load this code only when it’s actually needed or when the browser is idle, thereby freeing up the main thread and reducing JavaScript execution time.
For third-party packages depended on by the page, strict review is essential to prevent duplicate imports of the same packages or dependencies, such as React or Fusion. This leads to increased JavaScript size and thus longer execution times. For example, in one scenario, a third-party SDK we introduced was a hefty 1.6MB, larger than our host page’s 300KB code, indicating significant room for optimization.
Control the introduction of third-party scripts, or delay their loading as much as possible. Some advertising pages rely on many third-party analytics scripts, and their loading can block page rendering, thereby affecting FID.
Split Heavy Computational Tasks in JavaScript
For excessively heavy computational tasks, you can use requestAnimationFrame to split the tasks across multiple frames, thereby reducing JavaScript execution time and allowing the browser more idle time to respond to user interactions.
If computational tasks cannot be split, consider using Web Workers to execute them in a separate thread, thus not blocking the main thread.
CLS
CLS: Cumulative Layout Shift, measures the instability of content by summing the shift scores of all layout shifts that occur within 500 milliseconds of user input.
Reasons for poor CLS:
- Images without dimensions
- Ads, embeds, and iframes without dimensions
- Dynamically injected content
- Web Fonts causing Flash Of Invisible Text (FOIT)/Flash Of Unstyled Text (FOUT)
- Actions waiting for network responses before updating the DOM
In the context of international sites, key points to note are:
- Images need to have specific
widthandheightattributes instead ofauto, so the browser knows how much space to reserve before the image finishes downloading. - The main body of the page should be rendered synchronously as much as possible. For asynchronously rendered blocks, ensure proper placeholders are used to prevent the page from jumping around due to asynchronous rendering.
By largely adhering to these practices, CLS can meet the standard.
Strategy Accumulation
Throughout our year of optimization, we have accumulated several tools and experiences to help us rapidly improve performance.
Tools and System Accumulation
- agado*: A global performance measurement platform built by the client architecture team, allowing efficient access to a comprehensive performance measurement system with just a few lines of code.
- silkworm engine: A general isomorphic rendering service built by the buyer’s foundational technology team about five years ago, addressing the need for rapid integration of isomorphic capabilities for pages outside of specific solutions (e.g., stores, Tmall). It is currently maintained by @Xianyu.
- Streaming Rendering Second-Party Library: A solution for quickly integrating streaming rendering, which has connected various proxy layers in the early stages, reducing backend integration costs from 3 person-days to hours.
Achievements
SEO Performance Optimization
Increase in Good URL ratio in Google Search Console backend:
- PC: 0 -> 85.9%
- Mobile: 0 -> 95.1%
Specific performance metrics (arrows point to optimized results): Page performance has significantly improved across multiple scenarios. CLS and FID have all met the CWV Good URL standard, and LCP in the two scenarios we focused on also reached the Good URL standard. For SEO scenarios, due to search engine weighting from performance improvements and better reach, we observed a 10%~20% increase in UV (Unique Visitors) across multiple scenarios, significantly boosting the user base.
Paid Page Optimization
- Wap DPA page: LCP reduced by approximately 500ms. Business metrics: UV increased by about 9%, with significant improvements in other related business metrics such as click-through rate and cross-device performance.
- PC PLA page: LCP reduced by approximately 900ms. Business metrics: Core clicks increased by 16.1%, UV grew by 4.6%.
- And many other projects still in experimentation show varying degrees of business data growth.
Case Study
Having discussed a great deal of theoretical knowledge, we will now combine it with a practical example—the optimization of the mobile showroom (an SEO landing page)—to demonstrate how we applied the methods above to optimize a page that failed LCP, FID, and CLS standards into a ‘Good URL’.
Current State Analysis
When we took over the showroom, we only knew that its performance was very poor because business feedback indicated that the Google Search Console backend showed a 0% ‘Good URL’ compliance rate for our website, meaning LCP, CLS, and FID all failed. However, we had no idea how bad it was or where the specific problems lay.
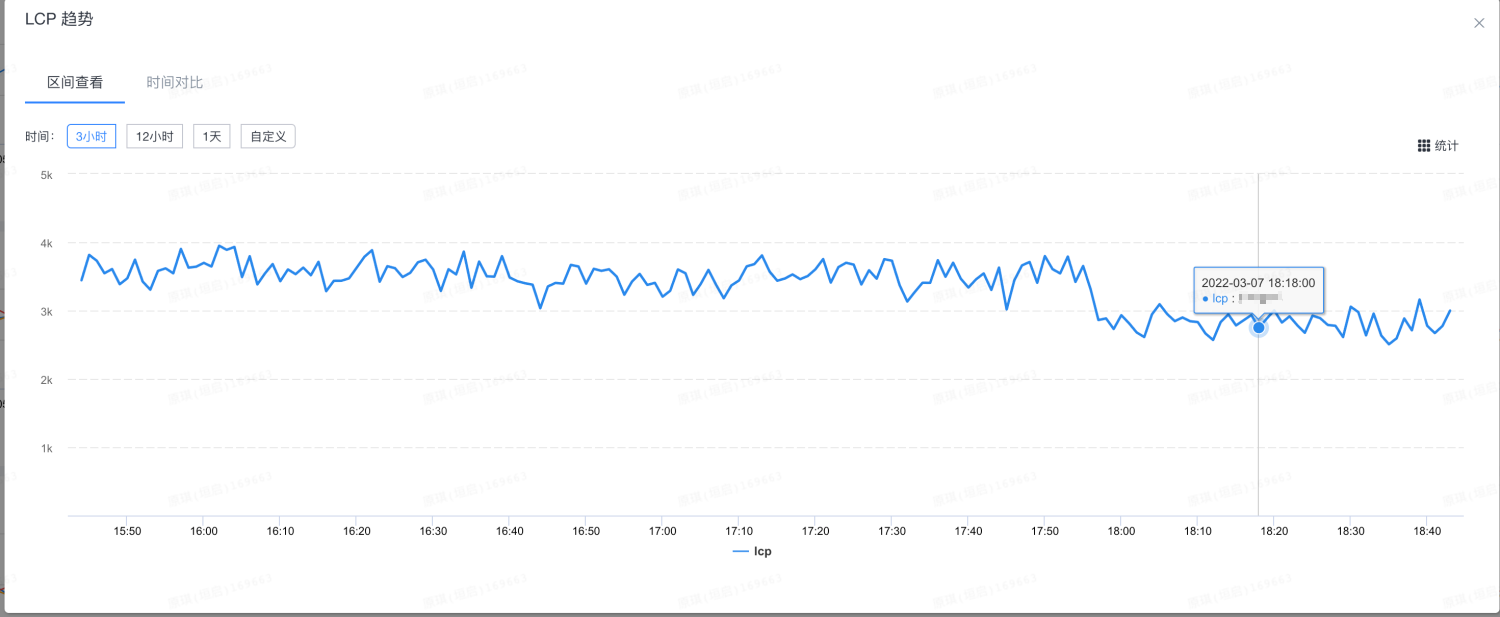
The demand for optimization was urgent, but without knowing the current state, optimization was impossible. Therefore, the first step was to devise a method for measuring the current state. After analysis and research, we adopted Google’s web-vitals library to collect user data, used big-brother (which ICBU had already integrated) to report the collected data, and configured xflush to display real-time data trends.
This is the final performance overview dashboard: 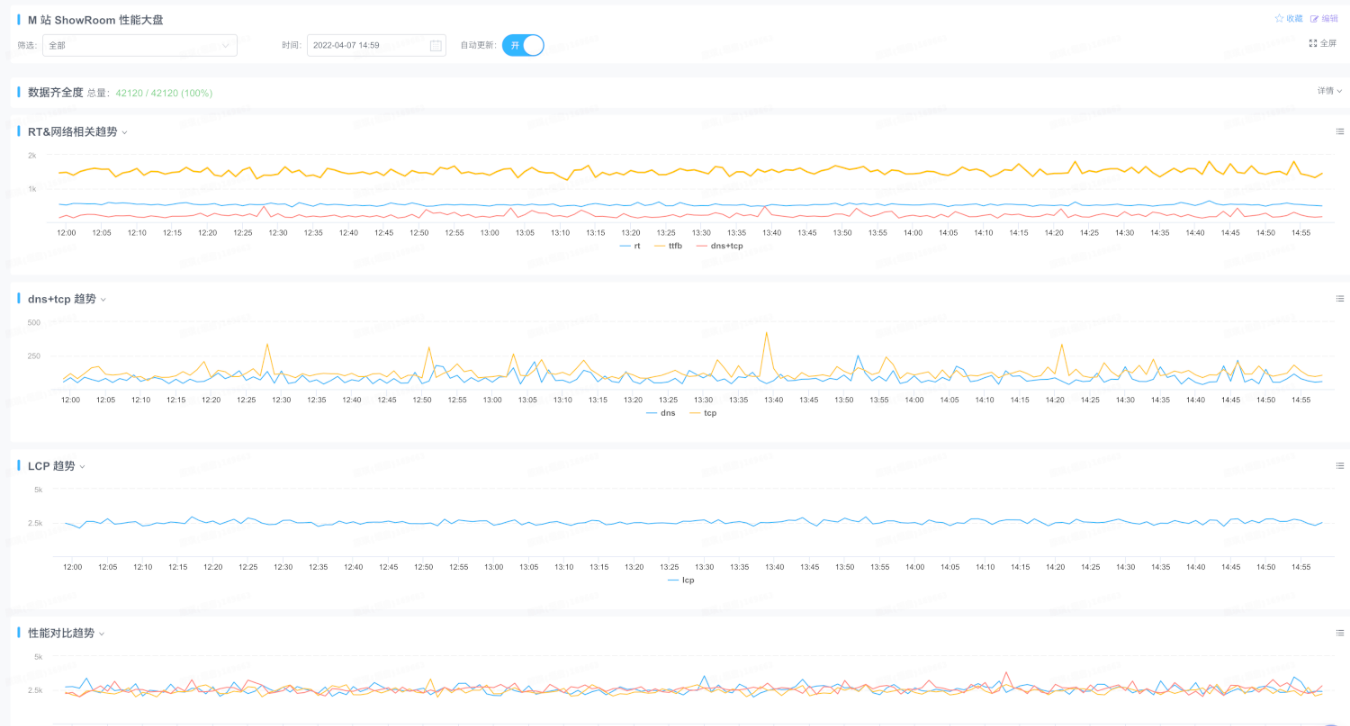
With the measurement solution in place, we obtained the current performance status: the data was poor, and LCP, CLS, and FID all required optimization.
With the performance data, let’s look at the showroom’s technical architecture:
- UI framework used: Rax + DX
- Rax was the group’s React-like UI library at the time.
- DX was a solution for cross-platform development, primarily used for dynamic configuration on native Android and iOS apps, with a compatible display solution for the Web.
- Rendering chain: Page skeleton was on CDN, JavaScript called asynchronous interfaces to fetch initial screen data, then asynchronously completed page rendering.
- Due to the use of DX, it was necessary to obtain the DX template string from backend data. The frontend then
evaluated this string and converted it into a Rax component via thedx-h5library, which Rax then rendered onto the page.
- Due to the use of DX, it was necessary to obtain the DX template string from backend data. The frontend then
- Style files: Because Rax and DX were used, styling and layout were ultimately achieved through inline styles, with no separate CSS files available for browser caching.
First Isomorphic Refactoring Attempt
First, let’s look at the components of LCP:  Due to asynchronous page rendering, even with HTML on a CDN, it didn’t help much, and the entire rendering chain was very long. After taking over, we first performed an isomorphic refactoring.
Since the original page used Rax + DX, where Rax was just a shell and the main content was rendered via DX, it required integrating with DX’s isomorphic capabilities. Coincidentally, an adjacent team had a DX isomorphic service, which we attempted to integrate.
First, we communicated with the Akamai team to remove the showroom’s HTML staticization solution from the CDN. Then, on the frontend, we made some modifications to integrate with DX’s isomorphic rendering.
After integration, although DX’s isomorphic rendering could achieve direct output, a serious problem existed: the HTML structure from the server-side data was different from the structure rendered by the frontend.
This caused the page to flicker during frontend JavaScript’s secondary rendering. Since the HTML structures were different, it couldn’t achieve React-like hydration. The LCP time also became the time after secondary rendering completion, and there wasn’t much optimization for page FID and CLS either.
Second Isomorphic Refactoring Attempt
The advantage of DX was a single configuration for three platforms. However, in actual Web-side usage, native app configurations led to various adaptation issues on the Web, eventually evolving into a component where native apps used one set of DX template configurations and external Web used another. This meant that native and external Web still maintained templates independently, thus losing DX’s original advantage.
Furthermore, using DX introduced many additional problems:
Low rendering efficiency: “What is the cost, Gul’dan?” DX aimed to solve cross-platform configuration issues, but cross-platform implies an intermediate layer, and each added layer incurs a cost, leading to ultimately low efficiency, high LCP and FID. Previous maintainers even attempted a WebAssembly-based DX solution, but it still didn’t solve many problems.

The output structure of the DX isomorphic rendering was inconsistent with the browser-side rendering, preventing further optimization.
Given these issues, we ultimately decided to refactor the showroom, abandoning the original DX and Rax solution and rewriting it with React.
Under React, various technical solutions are relatively mature. After refactoring, we integrated with the silkworm isomorphic service, which had been running for many years. React’s isomorphic solution is very mature and does not suffer from the flickering issues during secondary rendering seen with DX. Furthermore, without an intermediate ‘glue’ layer, rendering efficiency significantly improved compared to DX.

As you can see, the rendering chain became much simpler. Monitoring showed that LCP decreased by approximately 900ms, and FID dropped directly below the ‘Good’ standard of 100ms.
Critical Rendering Path Optimization
Application Splitting
The original showroom application was split from one large application into two: a foundational common package traffic-base and an upper-layer business application traffic-free-wap.
Typically, deployments are for traffic-free-wap, while traffic-base has a very low deployment frequency. This increases cache hit rates and also reduces deployment risks.
However, since the effect of caching is a long-term impact, changes in LCP are not visible in the short term.
Aplus Asynchronous Refactoring
aplus is the group’s tracking solution, requiring integration with an aplus.js script to implement various tracking, especially PV (page view) reporting. The original page’s aplus.js was loaded and executed synchronously, blocking page rendering. Therefore, we refactored it for asynchronous loading.
The modification needed is in the beacon module of the backend service; simply add async to the <script> tag within the beacon module:
[aplus]
aplusKeyUrl=.com
aplusKeyUrl=.net
aplusKeyUrl=.org
aplusKeyUrl=.cn
aplusKeyUrl=.hk
aplusKeyUrl=.vipserver
aplusLocation=header
aplusCmpType=find
aplusFilter=find"iframe_delete=true
aplusFilter=find"at_iframe=1
aplusFilter=find"/wangwang/update
aplusUrl=
<script
id="beacon-aplus"
async
src="//assets.alicdn.com/g/alilog/??aplus_plugin_icbufront/index.js,mlog/aplus_v2.js"
exparams="userid=\#getuid()\#&aplus&ali_beacon_id=\#getcookievalue(ali_beacon_id)\#&ali_apache_id=\#getcookievalue(ali_apache_id)\#&ali_apache_track=\#getcookievalue(ali_apache_track)\#&ali_apache_tracktmp=\#getcookievalue(ali_apache_tracktmp)\#&dmtrack_c={\#getHeaderValue(resin-trace)\#}&pageid=\#getpageid()\#&hn=\#gethostname()\#&asid=\#get_token()\#&treq=\#getHeaderValue(tsreq)\#&tres=\#getHeaderValue(tsres)\#">
</script>
After the Aplus asynchronous refactoring went live, monitoring showed an LCP improvement of 50ms.
Pre-connection, Preloading, and Domain Consolidation
Following our optimization strategy, all static resource domains for the entire showroom page were consolidated under s.alicdn.com.
At the same time, DNS pre-resolution and pre-connection were performed for the domains:
<link rel="preconnect" href="https://s.alicdn.com" crossorigin />
<link rel="dns-prefetch" href="https://s.alicdn.com" />
For several product images on the initial screen, preloading was implemented:
<link
  rel="preload"
  href="https://s.alicdn.com/@sc04/kf/H2df0c8cbb22d49a1b1a2ebdd29cedf05y.jpg_200x200.jpg"
  as="image"
/>
<link
  rel="preload"
  href="https://s.alicdn.com/@sc04/kf/H423ae0f4cf494848bb5c874632270299J.jpg_200x200.jpg"
  as="image"
/>
<link
  rel="preload"
  href="https://s.alicdn.com/@sc04/kf/Hdf15b5c8a7c544c2aee0b2616b2715e3K.jpg_200x200.jpg"
  as="image"
/>
After going live, monitoring showed an LCP improvement of approximately 200ms, stabilizing at the edge of the Good URL LCP standard, nearing compliance.
Streaming Rendering Refactoring
After completing the above optimizations, we began refactoring for streaming rendering. Frontend and backend teams jointly implemented the streaming rendering solution, and pre-release testing showed excellent results. However, it remained ineffective after going live, and we couldn’t pinpoint the reason despite continuous troubleshooting.
Finally, we remembered that we were using Akamai’s dynamic acceleration. This meant that user requests first hit Akamai’s CDN before reaching our backend service. Since our streaming rendering was implemented on the backend service, it was possible that the CDN was doing something that caused our solution to be ineffective.
After communicating with the CDN team, we discovered that a chunked response streaming configuration was needed. After adding it and re-deploying for testing, streaming rendering finally took effect. Upon going live, LCP immediately dropped by 500ms, reaching the CWV Good URL standard.
CLS Optimization
After LCP and FID met the standards, only CLS was still slightly off. For the showroom, the main CLS issues were the unstable header height and the inconsistent positioning of icons within product cards.
- For the header issue, we communicated with the business team to determine a fixed header height and added a placeholder.
- For the icon positioning issue, simply setting a fixed width specifically for them was sufficient.
By largely implementing these, CLS could meet the standard.
Optimization Summary
The showroom’s optimization process followed the frontend optimization methodology: measure -> analyze -> experiment. This step-by-step approach ultimately achieved the CWV Good URL standard, with the ‘good rate’ displayed in the Search Console backend consistently above 90%.
Furthermore, by meeting Google’s Good URL requirements, the showroom gained increased search ranking weight from Google. According to the measurement method provided by our Google liaison, the mobile showroom saw Clicks +10.6% and Impressions +8.8%, equivalent to an additional ~10% in unique visitors.
Conclusion
Without systematic theoretical guidance, performance optimization can easily become a fragmented task—fixing A when A is found, then B when B is found. This approach also leads to gradual degradation with business iterations, and if the direction is wrong, it’s easy to waste a lot of time without achieving desired results.
This article started from the theory of performance optimization and introduced some of our practices in performance optimization from three aspects: measurement, analysis, and validation, hoping to be helpful to everyone.
While some performance and business achievements have been made, many pages, such as paid landing pages, still have significant room for optimization and require continuous effort.